AmenRa's Corner

A place where a skillful caddy always offers cool contemplation when it comes to your "stick" selection


Creditcane™: I am the omega of the market. Heed my warnings.


SPX
Bullish long day. Bullish thrusting was gored. Midpoint below EMA(10). Back above the trendline (3/6/09-7/1//10). Held 1041.83 again (.1459 fibo from high). No daily 3LB changes (reversal is 1071.69). QE2infinity.


DXY
Doji day. Failed the SMA(144) again. Midpoint above EMA(10). No daily 3LB changes (reversal is 83.31).


VIX
Bearish long day. Midpoint below EMA(10). Still holding below weekly 3LB mid and monthly 3LB mid. Still below the SMA(89) and now the SMA(21). Daily 3LB reversal down (reversal is 27.46).
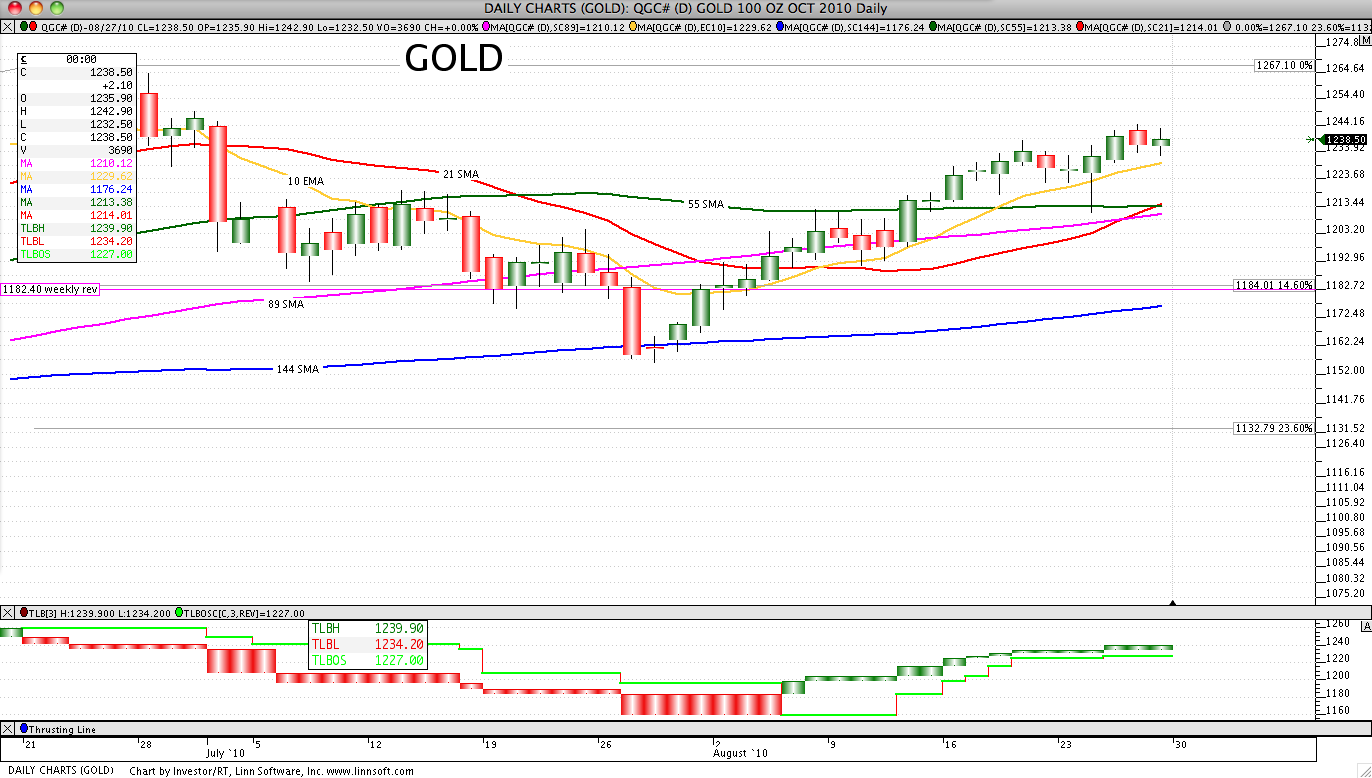


GOLD
Spinning top day. Possible non confirmation of bullish thrusting. Still above all SMA's. Midpoint above EMA(10). Still holding onto gains (heading towards the 0%). No daily 3LB changes (reversal is 1227.00).


EURUSD
Spinning top day. Midpoint below EMA(10). Held the 23.6% retrace. Still failing the 4x1 Gann. It's above the trendline (11/27/09-3/17/10). Daily 3LB reversal up (reversal now 1.2654).


JNK
Bullish short day. Still failing to close gap. Closed above yesterdays midpoint which weakens the bears game. Still above the SMA(89) and back above the SMA(144). Midpoint below EMA(10). No daily 3LB changes (reversal is 37.72).


10YR YIELD
Bullish LONG day. Confirmed inverted hammer. There are two gaps that need to be dealt with (closed one of them today). The new 0.0% fibo retrace at 24.69 held. Midpoint below EMA(10). Below all SMA's. No daily 3LB changes (reversal is 27.81).


AUDJPY
Bullish long day. Another bullish thrusting got gored. Tested but failed the SMA(55). Midpoint below EMA(10). Closed above the 23.6% retrace at 75.5696. No daily 3LB changes (reversal is 79.1783).


DJ TRANS AVG
Bullish long day. Back above the upper trendline and the SMA(233). Still below the SMA(55) and SMA(144). Midpoint below EMA(10). No daily 3LB changes (reversal is 4236.96). Avoided a weekly 3LB reversal (how? why?).


GS
Bearish short day. Below all SMA's. Midpoint below the EMA(10). Slowly inching lower (well not anymore). New low on daily 3LB (reversal is 146.74).


LEFTBACK'S BOND REPORT

The Bond Report 8.27.10

Heh heh heh.. this isn't your grandfather's bond market, is it? Credit markets used to be like lawn bowls, with 0.1% moves on the day, duly noted by learned scribes. Now it's up and down 2% a day, a sure sign that those bad boys, the highly leveraged hedge funds, have probably entered the fray.

Is nothing sacred? Bond trading should be like croquet, with elegantly dressed participants skillfully outwitting each other between sips of Bollinger. Suddenly it's like the WWF or the most bitter of college football rivalries, like Michigan v Ohio State, or Alabama v Auburn.

Here's KEITH JACKSON's take on the action:

"Whoa, Nellie! Folks, we got a real BARN-BURNER going on here in the credit market. You can tell that these BOND BULLS and BEARS just don't like each other a whole lot, we got a lot of good old-fashioned hittin' goin' on, and looky here, the LONG BOND seems to slow to get up, after being GANG TACKLED in the backfield, folks...."

Thanks, Keith. Well, it was a RISK-ON day, I think we all know that, as market participants heard the helicopters hovering and threatening to drop dollar bills on an unsuspecting populace. Today was a massive STEEPENER, with duration being sold in all markets. The 5y Ts were sold as well as investors sought out higher yield. HY outperformed IG, which had been looking rich in any case of late. Even TIPS were sold on a Flight From Quality. Doing the math, LB would say that there must be a lot of cash on hand, participants are waiting for developments.

Corpies: LQD -0.90%; AGG -0.55%; JNK 0.62%; HYG -0.11%;
Govies: TLT -2.83%; IEI -0.58%; TIP -0.59%
Hedgies: TBT 5.66%

Kudos to anyone who shorted the long bond last night - that was a ripper, we were simply not trading Ts due to lack of liquidity (poor planning). We did nothing, but smiled at the thought of having booked a 15% or so gain in TLT before today's slaughter. High volatility is often a characteristic of turns in the market, so yields may rise a little here. In fact, the Fed would like credit market participants to take on more risk. This is the intent of the QE lite.

Overall, the POMOs should keep a bid under the Treasury market and we see a quiet period for Ts and some tightening of spreads ahead. That's what we are counting on as we have moved out on the risk curve in search of yield, and will buy Ts from time to time as a hedge.


Morning Audibles 8.27.10 - Bam! Spliff! Pow! Holy cow BB-man!

Reading AMENRA's corner last night... CV was struck with curiosity by this cryptic comment...


Creditcane™: Bam! Spliff! Pow! Holy cow BB-man!


The first part is easy... We all know what Creditcane™ is (although nobody seems quite sure what it does)... And of course...


&


We know those as being what we do to our pillows and cognos & Harry Wanger voodoo dolls when our trades go the wrong way...


There is, of course, too, the I-Man option for SPLIFF...


But none of that was what was curious to CV... What got me curious was the...


BB-Man

That part was odd to me... Now, assuming AmenRa wasn't talking about a STUTTERING Robin, or this guy right here...


Related to this guy... Who you Chicago Cubs fans know very well...


And who mentored another famous Chicago prodigy...


So what was AMEN RA referring to with the use of "BB Man"? Frankly, I have no idea, but the thought took me on a little journey looking for things that I might be overlooking...

My first stop was BloomBerg... Where I ran across the Nenner video (if any of you have not seen it yet)...


Also... Batman's sidekick "Robin" Griffiths...


B-But the question still b-bothered me... Why were these men so b-bearish?


So I just decided to pull up some long term charts and see if there was anything to see... This is the end of the month, and the S&P cash is VERY close to what would be a "confirmation" of a MONTHLY 3lb  reversal (which reversed in May - b-but hasn't confirmed yet - as it requires a MONTHLY close below to confirm)... That level on the S&P is roughly 1130...


I wanted to see how it looked on a MONTHLY chart with 2,20 BOLLINGER BANDS... And here's how it looked...


I don't want to get into a lot of annotations here... Why? Because it's an odd way of looking at technicals... Some people get VERY PICKY about the TYPE of technicals they gravitate towards to underscore their own belief system... I did, casually, note the following:

- The horizontal blue line is the 1030 level which would be the MONTHLY 3lb reversal confirmation line... What's interesting about this level, is that it corresponds somewhat to the 1998 LTCM crisis, the "capitulation" in the summer of '02 recession, the confirmation base for the '04-'07 rally, and the "capitulation" point of the '08 credit crisis... 

- The red elliptical circles are points when the MONTHLY candles "took out" the midpoint of the BB's... What I see are TWICE (in '00, and in '08), it turned out to be the beginning of a VERY LONG & STEEP decline in equity prices... The exception was in 1998, after LTCM, (which was probably due to the fact that it was more of an "isolated" credit event - at the time)... In ALL cases, the MONTHLY CANDLE (and for that matter, the length of the candles in advance of) the crossover of the midpoint of the BB's were VERY LONG (as is the case right now)...

These are just observations...

I also decided to take a look at this on a weekly basis...


Again, no particular annotations, only to say that on the last major high in the S&P (Oct '07), when the WEEKLY CANDLE closed under the lower shadow of price band level (when the market was at its high), then prices began to collapse soon thereafter...

What is also interesting to note is that in this moment, the MIDPOINT of the MONTHLY BB is 1007, while the LOW SHADOW of the 2,20 BB's is 1009... Of course, both levels are in very close alignment with the 1010 low of 2010...

So I don't know if any of this means anything or not... But it may make a case for considering that despite the S&P having some very short term OVERSOLD technicals, in the past (decade) the most major vicious moves down have actually come at points such as this...


AmenRa's Corner

A place where a skillful caddy always offers cool contemplation when it comes to your "stick" selection


Creditcane™: Bam! Spliff! Pow! Holy cow BB-man!


SPX
Bearish long day. Confirmed bullish thrusting. Midpoint below EMA(10). Still below the trendline (3/6/09-7/1//10). Held 1041.83 (.1459 fibo from high). New low on daily 3LB (reversal is 1071.69). QE2infinity.


DXY
Bearish short day. Failed the SMA(144). Midpoint above EMA(10). Daily 3LB reversal down (reversal now 83.31).


VIX
Bullish short day. Midpoint above EMA(10). Still holding below weekly 3LB mid but above monthly 3LB mid. Still below the SMA(89). Couldn't get above yesterdays midpoint. No daily 3LB changes (reversal is 25.73).


GOLD
Bearish thrusting day. Still above all SMA's. Midpoint above EMA(10). Still holding onto gains (heading towards the 0%). No daily 3LB changes (reversal is 1227.00).


EURUSD
Bullish short day. Midpoint below EMA(10). Tested the 23.6% retrace (passed). Still failing the 4x1 Gann. It's above the trendline (11/27/09-3/17/10). Daily 3LB reversal up (reversal now 1.2654).


JNK
Bearish long day. Held the 50% retrace. Still failing to close gap. Still above the SMA(89) but below the SMA(144). Midpoint below EMA(10). It's screaming Risk off! Risk off! To hell with "THE FUN". No daily 3LB changes (reversal is 37.72).


10YR YIELD
Inverted hammer day. May be refusing to go lower. There are two gaps that need to be dealt with. The new 0.0% fibo retrace at 24.69 held. Midpoint below EMA(10). Below all SMA's. No daily 3LB changes (reversal is 27.81).


AUDJPY
Doji day. Failed to confirm bullish thrusting (aka down move may have halted). Way below the SMA(55). Midpoint below EMA(10). Held the 14.6% retrace at 74.1352 (again). No daily 3LB changes (reversal is 79.1783).


DJ TRANS AVG
Spinning top day (with a lot of "hair"). Actually confirmed bullish harami. Still failing the trendline and the SMA(233). Below the SMA(55) and SMA(144). Midpoint below EMA(10). No daily 3LB changes (reversal is 4236.96). Also below weekly 3LB reversal price.


AAPL
Bearish long day. Tried to close window but failed miserably. Below the SMA(21), SMA(55), SMA(89) and now the SMA(144). Midpoint below EMA(10). No daily 3LB changes (reversal is 235.86).


Morning Audibles 8.26.10 - Out this Morning - Be Back Soon

I'm going to be out most of the morning, so I'm just going to have to keep it simple, and just give you a primer on what's going on this morning, and utilize the support of my new assistant to explain to you the debt problem...


Stocks Rebound From Seven-Week Low, U.S. Futures Climb
http://www.bloomberg.com/news/2010-08-26/asian-stocks-copper-rise-yen-weakens-on-speculation-japan-may-intervene.html


Exceprt:
Stocks rebounded from a seven-week low, U.S. index futures gained and commodities advanced as earnings improved and speculation increased that the Federal Reserve will act to support the U.S. recovery. The yen weakened.


(CV Raises hand in rooms and asks): "Is this the same FED that was saying this a few weeks ago? 'Nevertheless, most official and private forecasters still expect trend or above-trend growth.  Last week’s FOMC statement noted that “…the Committee anticipates a gradual return to higher levels of resource utilization…,” which we interpret as growth of around 3% coupled with a modest decline in the unemployment rate to 9% or a bit below over the next year.  And according to the August 2010 survey by Blue Chip Economic Indicators, Inc., the average private-sector forecaster still expects real GDP growth of 2.4% in the third quarter, 2.7% in the fourth quarter, and 3% in 2011 (on a Q4/Q4 basis), as well as a drop in the unemployment rate from 9.5% now to 8.8% at the end of 2010.'... Just asking? - I want to get my facts straight


“QE No. 2 is going to come over the next quarter,” Alain Bokobza, (who is changing his name to "bazooka") the head of multiasset strategy at Societe Generale SA in Paris, said on Bloomberg Television’s “On The Move with Francine Lacqua.” “This might be a trigger to allocate out of bonds into more riskier assets including equities or commodities.”


The gain in U.S. futures indicated the S&P 500 will advance for a second day. A report may show claims for jobless benefits declined to 490,000 last week from a nine-month high of half a million the prior week, according to a Bloomberg survey of 48 economists. The Labor Department is due to release the data today at 8:30 a.m. in Washington. U.S. gross domestic product probably expanded at a 1.4 percent pace in the second quarter, down from the 2.4 percent rate calculated last month, a Bloomberg survey indicated before a Commerce Department report due tomorrow.


In other news, the Labor Department and the BEA are scheduled to announce that the "great Pumpkin will bring toys to all boys and girls on October 31st, When that fails to occur, they'll remind you that Santa will arrive on the night of December 25th... and when that doesn't happen, the tooth fairy will make a few unscheduled appearances sometime... To be determined later...


All I really want to know is "How Much Is This Costing Me?"... This is where I'll need the assistance of my lovely new assistant to explain it to you (on account of CV is busy this morning)...


Here's how it got to be that way... (Turns out it's just a WORD thing after all)...


But relax... There's a a guy who can solve all of this... He's just gotta finish his lobster dinner first...


"Down Down Down"

AmenRa's Corner

A place where a skillful caddy always offers cool contemplation when it comes to your "stick" selection


Creditcane™: Looks like the market is about to hit my wall again.


SPX
Bullish short day. Midpoint below EMA(10). Still below the trendline (3/6/09-7/1//10). Tested and held 1041.83 (.1459 fibo from high). No daily 3LB changes (reversal is 1075.63). QE2infinity.


DXY
Doji day. Held the SMA(144). Midpoint above EMA(10). No daily 3LB changes (reversal is 82.95).


VIX
Bearish long day. Midpoint above EMA(10). Still holding below weekly 3LB mid but above monthly 3LB mid. Now below the SMA(89). No daily 3LB changes (reversal is 25.73).


GOLD
Bullish long day. Still above all SMA's. Midpoint above EMA(10). Still holding onto gains (heading towards the 0%). New high on daily 3LB (reversal is 1227.00).


EURUSD
Spinning top day again. Midpoint below EMA(10). Tested the 23.6% retrace (failed). Still failing the 4x1 Gann. It's above the trendline (11/27/09-3/17/10). New low on daily 3LB (reversal is 1.2709).


JNK
Hammer day. Held the 50% retrace. Still failing to close gap. Still above the SMA(89) and the SMA(144). Midpoint below EMA(10). No daily 3LB changes (reversal is 37.72).


10YR YIELD
Bullish engulfing day. First gap is the main resistance. New gap is additional resistance. The new 0.0% fibo retrace at 24.69 held. Midpoint below EMA(10). Below all SMA's. No daily 3LB changes (reversal is 27.81).


AUDJPY
Bullish thrusting day. Way below the SMA(55). Midpoint below EMA(10). Held the 14.6% retrace at 74.1352 (again). No daily 3LB changes (reversal is 79.1783).


DJ TRANS AVG
Bullish harami day. Still failing the trendline and the SMA(233). Below the SMA(55) and SMA(144). Midpoint below EMA(10). No daily 3LB changes (reversal is 4236.96). Also below weekly 3LB reversal price.


WTI
Bullish piercing day. Below all SMA's. Midpoint below the EMA(10). No daily 3LB changes (reversal is 74.79).


LEFTBACK'S BOND REPORT

The Bond Report 8.25.10

Another bizarro day in Bond World. After ticking 2.419% this morning, the 10y immediately reversed and finished the day at 2.54%. HY recovered well during the day and was bought heavily in the last half-hour, as usual. That's where the PROS trade, son. IG was steady.

Corpies: LQD 0.19%; AGG -0.23%; JNK -0.05%; HYG -0.13%;
Govies: TLT -0.33%; IEI -0.26%; TIP 0.00%
Hedgies: TBT 0.72%

LB is now only involved in IG and HY, so the action in the Treasury pit was simply the amusement du jour. There is a POMO in the 10y/30y tomorrow, and we expect to see a lower high in TLT, or a higher low in the yield, that might be a good place to start shorts, now that there are no shorts any more.... but our attentions are elsewhere for now.

Disclosure/Warning

This blog should not be interpreted as investment advice of any kind. The authors are NOT representing themselves CTAs or CFAs or Investment/Trading Advisor of any kind. The authors may or may not trade in the markets discussed. The authors may hold positions opposite of what may by inferred by this blog.The information contained in this blog is taken from sources the authors believes to be reliable, but it is not guaranteed by the authors as to the accuracy or completeness thereof and is presented here for information purposes only. Commodity trading involves risk and is not for everyone.