A place where a skillful caddy always offers cool contemplation when it comes to your "stick" selection.

Creditcane™: I'm being held for ransom by the bulls.
 SPX
SPXBullish short day. Midpoint above EMA(10). Still above all SMA's. Above the 14.6% retrace (1319.09). New high on daily 3LB (reversal is 1305.14). QE2infinity. "JBTFD. Don't question it. Just do it. Trust me."
 DXY
DXYBearish short day (tail too short for hammer). Midpoint below EMA(10). Made a new 0.% retrace (73.74). Below all SMA's. New low on daily 3LB (reversal is 75.50).
 VIX
VIXBearish harami day (but we're in a downtrend not an uptrend…hmmm). Midpoint below EMA(10). Still below all SMA's. New low on daily 3LB (reversal is 16.27). Deep in the "no fear" zone.
 GOLD
GOLDSpinning top day. Midpoint above EMA(10). Made a new 0.0% retrace. Still above all SMA's. New high on daily 3LB (reversal is 1492.90). Holding above upper trend line. Must have the precious.
 EURUSD
Spinning top day. Midpoint above EMA(10). Still above 1.4374 (the 76.4% retrace). Still above all SMA's. New high on daily 3LB (reversal is 1.4215).
 JNK
JNKBullish short day (tail too short for hanging man). Midpoint above EMA(10). Back above all SMA's. Back above its 85.4% retrace (40.60). Still below lower trend line. New high on daily 3LB (reversal is 40.46).
 10YR YIELD
Bullish short day (no confirmation closed unchanged). No test of 0.0% retrace at 37.44. Still below all SMA's. Midpoint below EMA(10). Tested and held 38.2% retrace (33.71). Held the upper trend line. No daily 3LB changes (reversal is 34.66).
 DJ TRANS AVG
Bullish short day. Back above SMA(21). Midpoint above EMA(10). No daily 3LB changes (reversal is 5370.47).
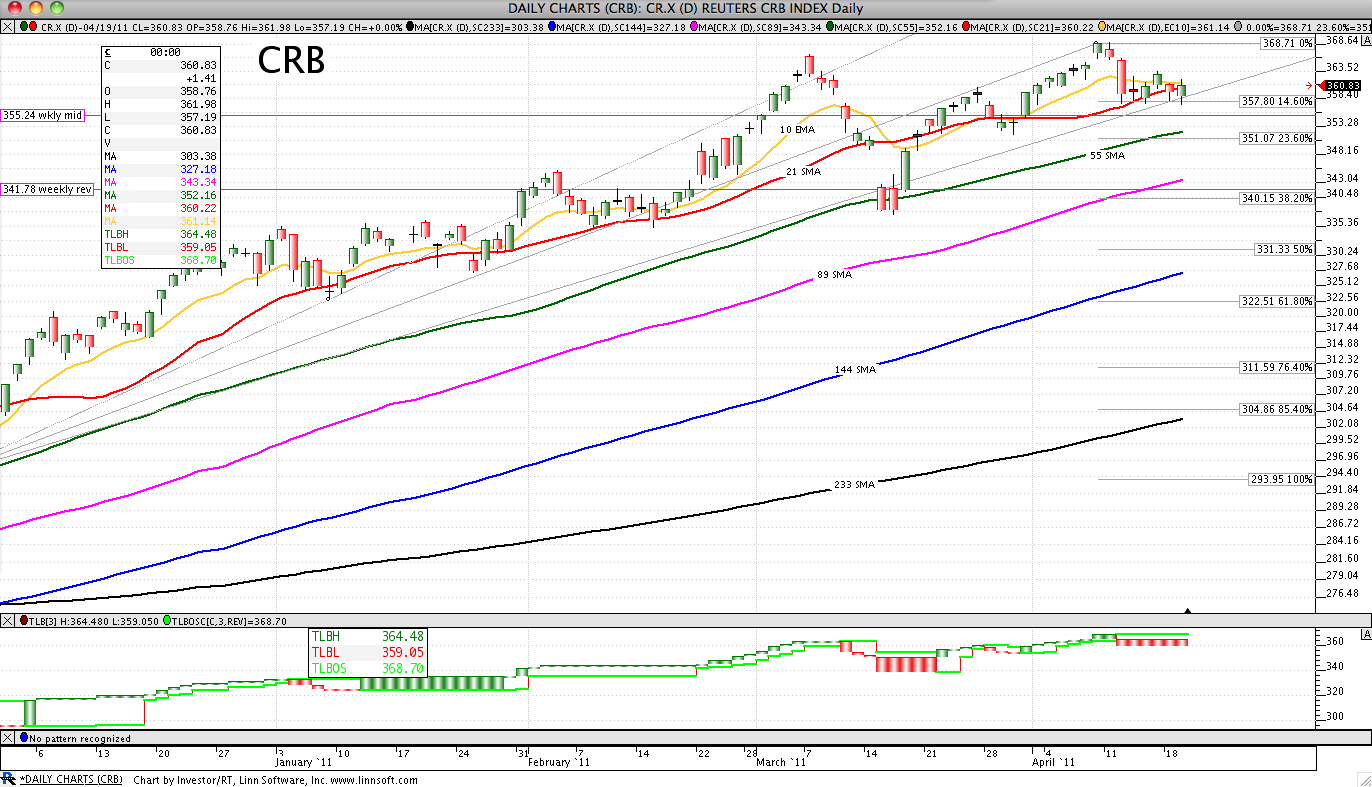
 CRB
CRBHanging man day. Midpoint above EMA(10). Still above SMA(21). Still above the 14.6% retrace (357.80). No daily 3LB changes (reversal is 368.70).
 WTI
WTIBullish short day. Still above all SMA's. Midpoint above EMA(10). No test of 0.0% retrace. No dally 3LB changes (reversal is 113.38). Still above weekly 3LB mid (108.61).
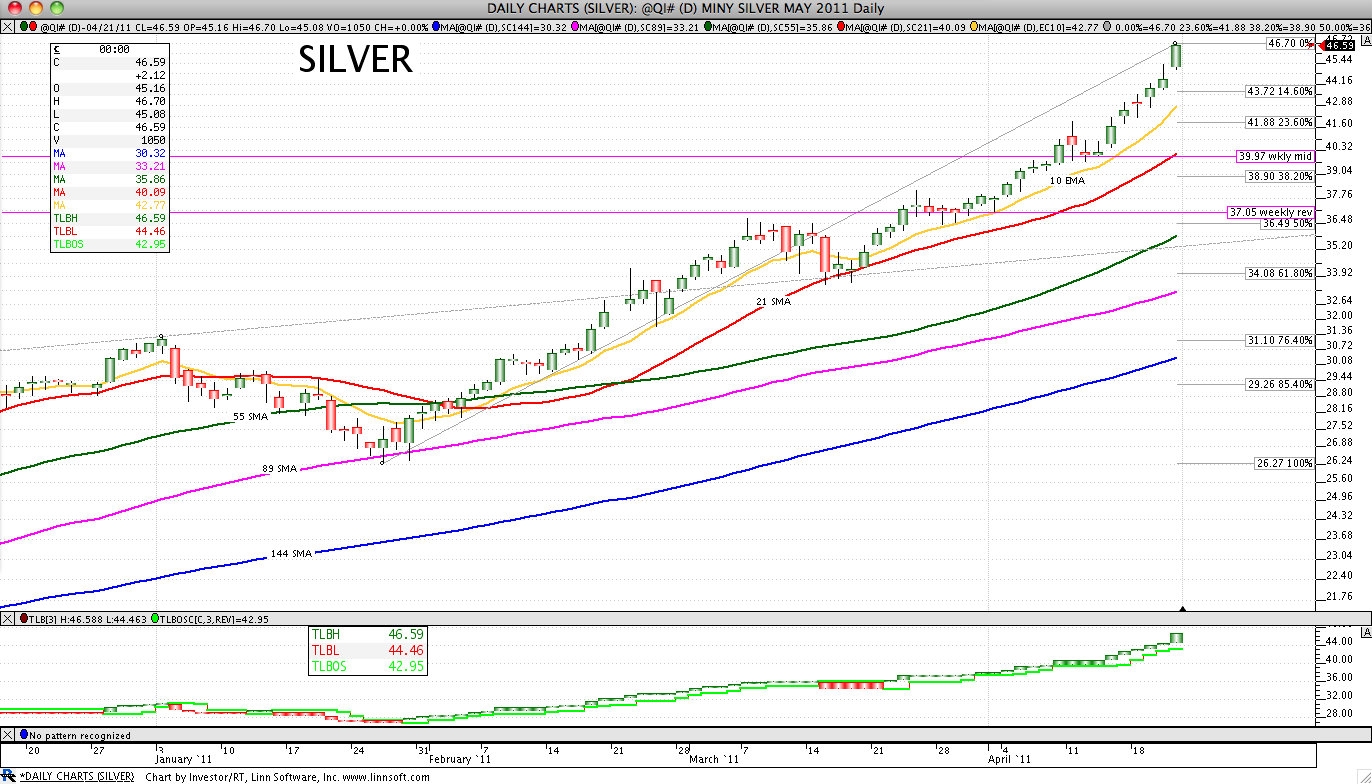 SILVER
Bullish long day. Still above all SMA's. Midpoint above EMA(10). Made a new 0.0% retrace. Holding upper trend line. New high on daily 3LB (reversal is 42.95). Registered or eligible is the question.