A place where a skillful caddy always offers cool contemplation when it comes to your "stick" selection.
 "OK, who told the HFT Police where the party was located?"
Creditcane™: C'mon Bears. I gave you the perfect opening. You have to learn how to close out the game.
 SPX
SPXBearish harami day (better get confirmed). Midpoint above EMA(10). Above all SMA's. Held above trend line (3/6/09-7/1/10). Holding well above the 38.2% minor retrace (1312.78). No daily 3LB changes (reversal is 1307.41). QE2infinity.
 DXY
DXYBullish short day. Midpoint above EMA(10). Tested and held the 61.8% minor retrace (74.94). Now above SMA(89). Held its weekly 3LB mid. No daily 3LB changes (reversal is 73.78).
 VIX
VIXBearish long day. Midpoint below EMA(10). Below all SMA's. Blew through its 38.2% minor retrace (17.51). No daily 3LB changes (reversal is 21.32). Extradited back to the "no fear" zone.
 GOLD
GOLDBullish short day (evening star fail). Midpoint above EMA(10). Held its 38.2% minor retrace (1529.89). Easily held SMA(21). No daily 3LB changes (reversal is 1557.30). Holding above upper trend line. Must have the precious.
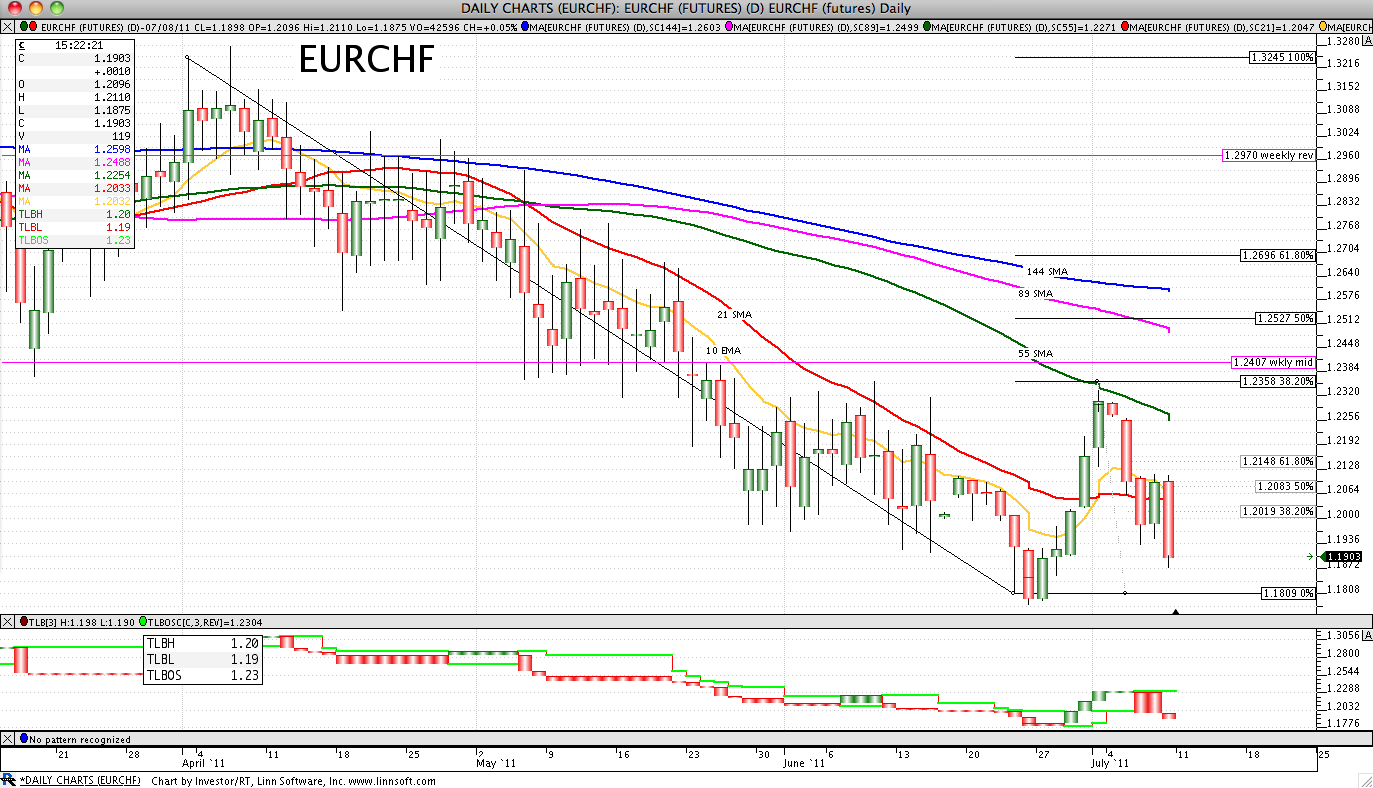 EURCHF
Bearish long day (failed bullish harami). Midpoint below EMA(10). Tested and failed its 38.2% minor retrace (1.2019). Tested and failed SMA(21). New low on daily 3LB (reversal is 1.2304).
 JNK
JNKBullish long day (yet closed lower). Midpoint above EMA(10). Held SMA(89). Held its 61.8%% retrace (40.20). Held above trend line (2/5/10-2/12/10). No daily 3LB changes (reversal is 39.93).
 10YR YIELD
Bearish LONG day. Tested and failed SMA(21). Midpoint above EMA(10). Failed its 38.2% retrace (31.19) and 61.8% minor retrace (30.18). Back below the upper trend line. No daily 3LB changes (reversal is 29.09).
 WTI
WTIBearish engulfing day. Held SMA(21). Midpoint above EMA(10). Tested and failed its 50.0% minor retrace (96.60). No dally 3LB changes (reversal is 91.02).
 SILVER
Bullish short day. Held SMA(21). Midpoint above EMA(10). Back above the upper trend line. Held its 61.8% retrace (35.20). No daily 3LB changes (reversal is 37.88).
 BKX
BKXBearish long day (closed gap). Midpoint above EMA(10). Failing SMA(55). Failed its 61.8% retrace (48.82). No daily 3LB changes (reversal is 46.64).
 HYG/LQD
Spinning top day. Failed SMA(55). Midpoint above EMA(10). Tested and failed its 50.0% retrace (0.8252). No daily 3LB changes (reversal is 0.8146).
 TLT
TLTBullish harami day. Midpoint below EMA(10). Held SMA(89). Trading below its upper trend line. Tested and failed its 38.2% retrace#1 (94.22). No daily 3LB changes (reversal is 94.88).

IT HAS BEGUN. BE WARNED.


