A place where a skillful caddy always offers cool contemplation when it comes to your "stick" selection.

Creditcane™: Dear Bears: My name is Intervention. Be afraid when you hear it.
 SPX
SPXShooting star day (yet confirmed bullish harami). Midpoint below EMA(10). Held SMA(89). Above the 38.2% retrace (1278.72). No daily 3LB changes (reversal is 1306.10). QE2infinity. "JBTFD" or "Intervention" now mean the same thing. Had a weekly 3LB reversal down.
 DXY
DXYBearish short day. Midpoint below EMA(10). Now below the 0.0% retrace (77.54) from 11/4/10. Below all SMA's. New low on daily 3LB (reversal is 76.35).
 VIX
VIXBullish short day (confirmed bearish harami). Midpoint above EMA(10). Above all SMA's. No daily 3LB changes (reversal is 20.80). Back below monthly 3LB & weekly 3LB mid. Still in the "some fear" zone.
 GOLD
GOLDBullish long day (confirmed hammer). Midpoint above EMA(10). No test of 0.0% retrace. Back above SMA(21). No daily 3LB changes (reversal is 1437.70). Held above upper trend line. Must have the precious.
 AUDJPY
Bearish long day (yet completed morning star). Midpoint below EMA(10). Back above SMA(233). Also failed to hold its 61.8% retrace (0.7995). No daily 3LB changes (reversal is 0.8157).
 JNK
JNKDoji day. Midpoint above EMA(10). Back above SMA(144) & SMA(89). Back above its 38.2% retrace (40.21). Still below lower trend line. Daily 3LB reversal up (reversal is 39.58).
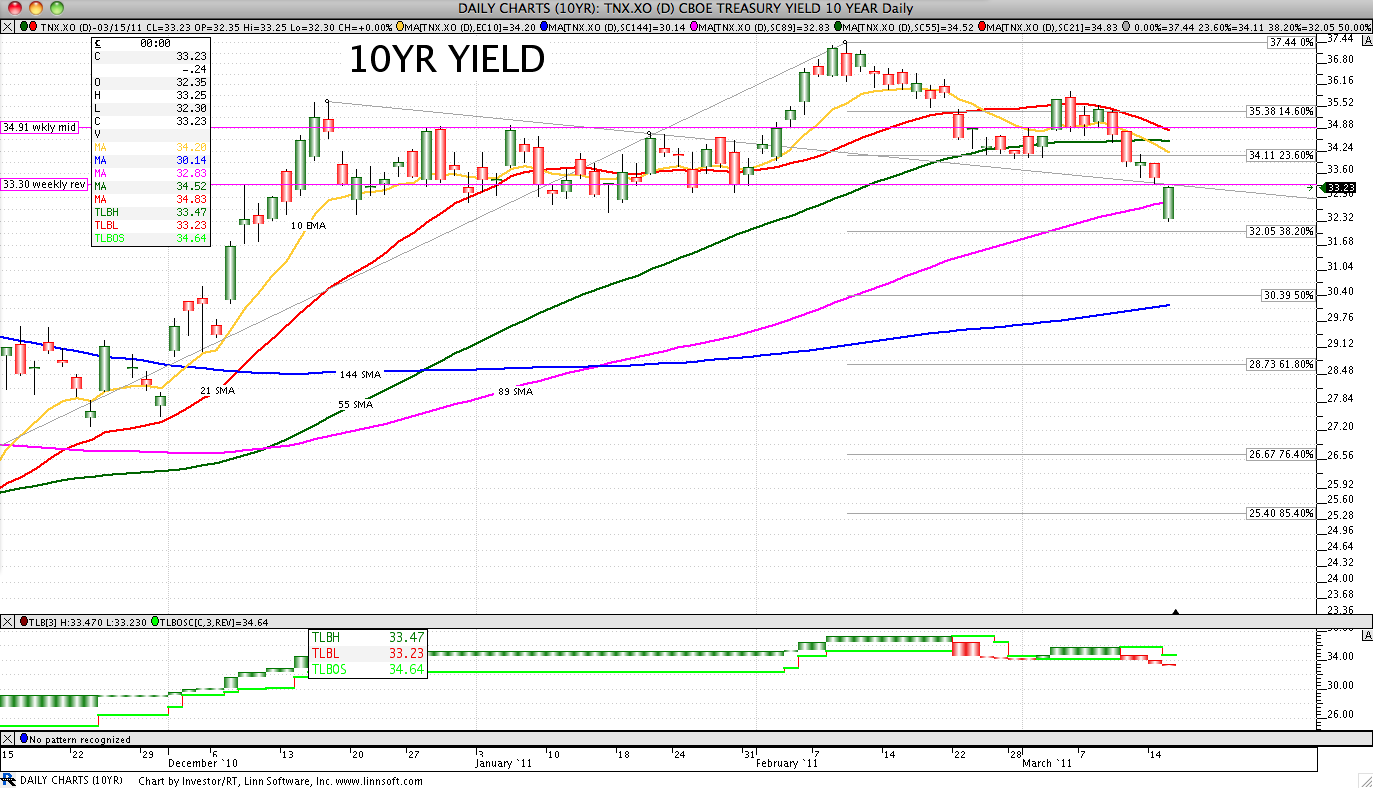
 10YR YIELD
Bullish short day. No test of 0.0% retrace at 37.44. Still failing SMA(89). Midpoint below EMA(10). Held the 38.2% retrace (32.05). No daily 3LB changes (reversal is 33.93).
 DJ TRANS AVG
Bullish short day. Still below SMA(89). Midpoint below EMA(10). No daily 3LB changes (reversal is 5093.23). No weekly 3LB reversal.
 CRB
CRBSpinning top day. Midpoint above EMA(10). Still below SMA(21). Held the 23.6% retrace (349.54). No daily 3LB changes (reversal is 354.45).
 XLF
XLFDoji day. Midpoint below EMA(10). Still below SMA(21). No test of 0.0% retrace. No daily 3LB changes (reversal is 16.77). No weekly 3LB reversal.
 WTI
WTISpinning top day. Still above all SMA's. Midpoint above EMA(10). No test 0.0% retrace. Tested and failed the 14.6% retrace (103.49). No daily 3LB changes (reversal is 106.41).
 SILVER
Bullish long day. Still above all SMA's. Midpoint below EMA(10). No test 0.0% retrace. Tested and held upper trend line. No daily 3LB changes (reversal is 36.05).