A place where a skillful caddy always offers cool contemplation when it comes to your "stick" selection.

Creditcane™: I was in the building but kept getting lost.
 SPX
SPXSpinning top day (evening star start?). Midpoint above EMA(10). Above all SMA's. Tested but failed the 14.6% retrace (1319.09). New high on daily 3LB (reversal is 1256.88). QE2infinity. "JBTFD. Don't question it. Just do it."
 DXY
DXYBullish long day. Midpoint below EMA(10). Held the 0.0% retrace (75.63) from 11/4/10. Below all SMA's. No daily 3LB changes (reversal is 76.33).
 VIX
VIXTakuri day. Midpoint below EMA(10). Still below all SMA's. New low on daily 3LB (reversal is 20.21). Still below monthly 3LB & weekly 3LB mid. Still in the "no fear" zone.
 GOLD
GOLDSpinning top day again. Midpoint above EMA(10). No test of 0.0% retrace. Still above all SMA's. No daily 3LB changes (reversal is 1392.80). Holding above upper trend line. Must have the precious.
 EURUSD
Bearish long day. Midpoint above EMA(10). Still above 1.3870 (the 61.8% retrace). Above all SMA's. No daily 3LB changes (reversal is 1.3978). Is the run up finally over?
 JNK
JNKBearish short day. Midpoint above EMA(10). Now above all SMA's. Closed below its 50.0% retrace (40.42). Still below lower trend line. No daily 3LB changes (reversal is 39.87).
 IQI
IQIBearish short day. Midpoint above EMA(10). Still below SMA(89). Holding above its 23.6% retrace (11.68). No daily 3LB changes (reversal is 12.30). Still above its weekly 3LB mid (11.76).
 10YR YIELD
Bullish long day. No test of 0.0% retrace at 37.44. Still above SMA(21). Midpoint above EMA(10). Held the upper trend line. New high on daily 3LB (reversal is 32.12).
 WTI
WTISpinning top day again. Still above all SMA's. Midpoint above EMA(10). No test 0.0% retrace. Holding above the 14.6% retrace (103.64). No daily 3LB changes (reversal is 106.41).
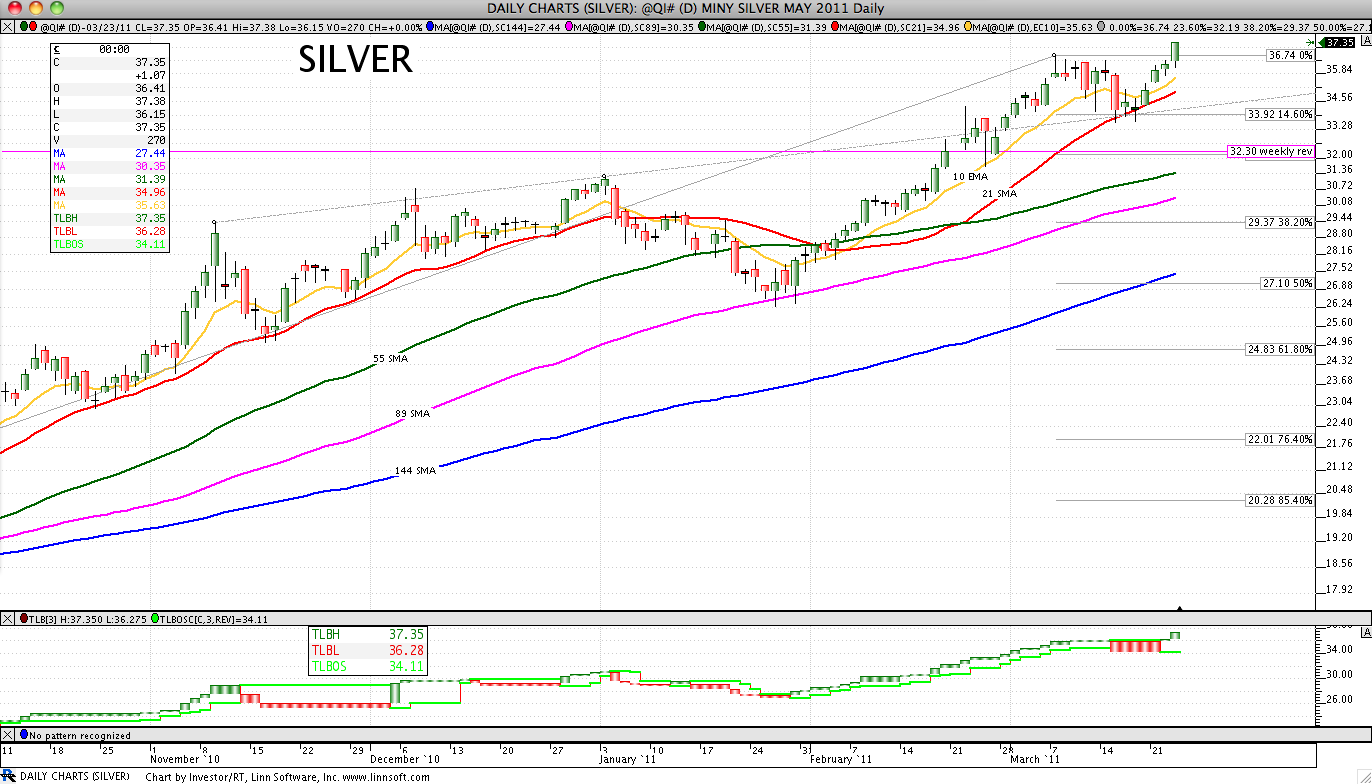
 SILVER
Spinning top day. Still above all SMA's. Midpoint above EMA(10). No test of 0.0% retrace. Holding upper trend line. No daily 3LB changes (reversal is 35.86).
 BKX
BKXBullish short day. Midpoint below EMA(10). Tested and held SMA(89). Above its 38.2% retrace (51.48). No daily 3LB changes (reversal is 53.31).