

Creditcane™: Can you say CAC? C-A-C. Now go and say that to one of the Greek creditors.
 SPX
SPXBullish short day. Midpoint above EMA(10). Still above all SMA's. Holding above the 0.0% retrace (1359.44). New high on daily 3LB (reversal is 1361.23). QE2infinity.
 DXY
DXYBearish long day. Midpoint below EMA(10). Tested and failed the 38.2% retrace (78.43). Failing SMA(21,55,89). Daily 3LB reversal down (reversal is 79.67).
 VIX
VIXBullish thrusting day. Midpoint below EMA(10). Failing all SMA's. Failing its 61.8% minor retrace (18.81). No daily 3LB changes (reversal is 21.14).
 GOLD
GOLDBearish short day. Midpoint above EMA(10). Holding above its 38.2% retrace (1721.30). Still above all SMA's. No daily 3LB changes (reversal is 1717.70). Still above monthly 3LB mid. Must have the precious.
 EURUSD
Bullish long day. Midpoint above EMA(10). Holding above SMA(89). Holding above its 61.8% minor retrace (1.3222). New high on daily 3LB (reversal is 1.3063).
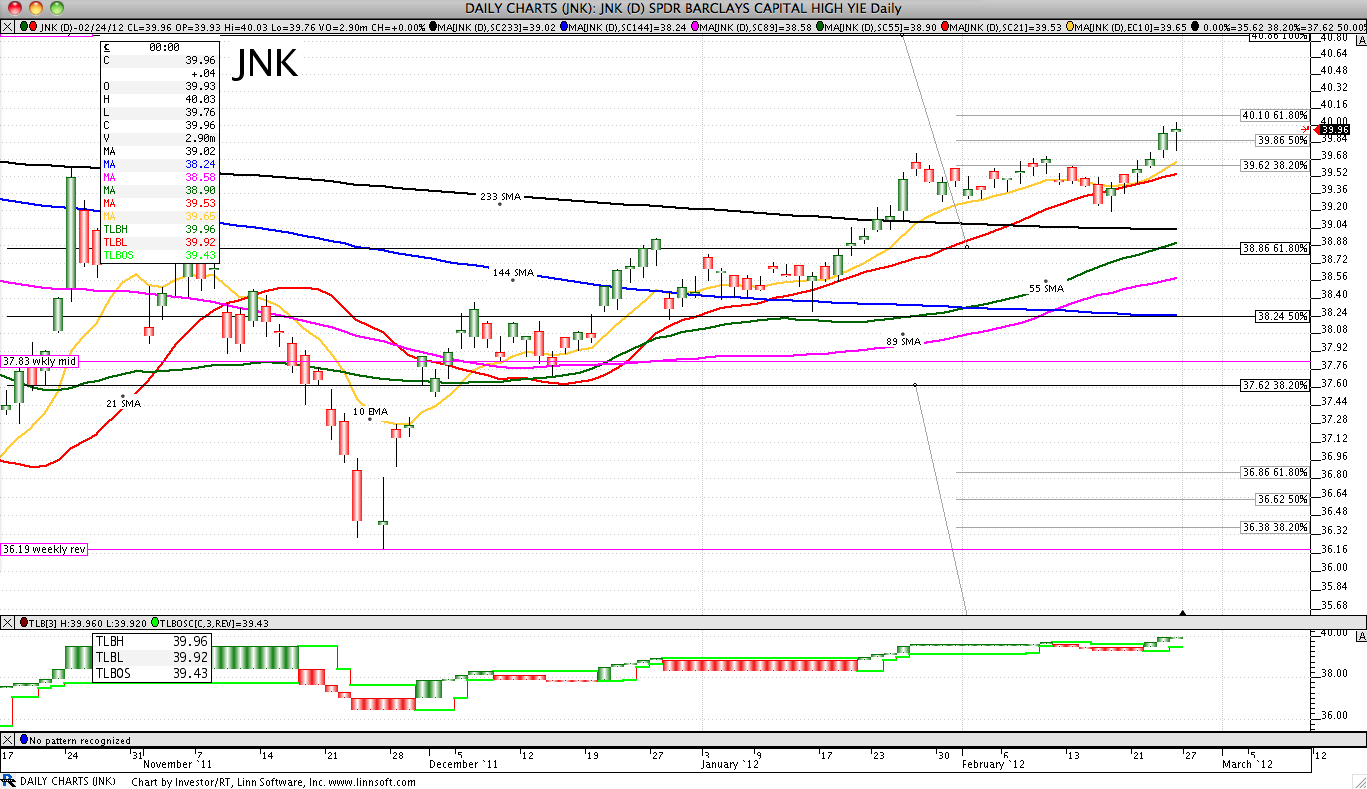 JNK
JNKSpinning top day. Midpoint above EMA(10). Holding above all SMA's. Tested and held its 50.0% minor retrace (39.86). New high on daily 3LB (reversal is 39.43).
 10YR YIELD
Bearish short day. Failing SMA(89). Midpoint below EMA(10). Holding above its 0.0% retrace (18.96). No daily 3LB changes (reversal is 20.47).
 WTI
WTIBullish short day. Still above all SMA's. Midpoint above EMA(10). Tested and held its 50.0% minor retrace (109.54). New high on dally 3LB (reversal is 106.25). Not confirming the monthly 3LB reversal down.
 SILVER
Spinning top day (bearish harami?). Tested and failed SMA(233). Midpoint above EMA(10). Tested and held its 62.8% retrace (35.32). No daily 3LB changes (reversal is 33.21).
 BKX
BKXBearish short day. Midpoint above EMA(10). Still above all SMA's. Holding above its 50.0% retrace (43.76). No daily 3LB changes (reversal is 43.62).
 HYG/LQD
Spinning top day. Holding above SMA(21). Midpoint above EMA(10). Holding above its 38.2% retrace (0.7808). No daily 3LB changes (reversal is 0.7908).
 EEM
EEMBullish short day. Midpoint above EMA(10). Holding above all SMA's. Holding above its 61.8% retrace (43.48). New high on daily 3LB (reversal is 42.92).
 RUSSELL 2K
Bearish short day. Midpoint above EMA(10). Still above all SMA's. Failing its 0.0% retrace (832.23). No daily 3LB changes (reversal is 798.19).

IT HAS BEGUN. YOU HAVE BEEN WARNED.


