 aka the Fed, BOJ and ECB

Creditcane™: REPETERE AD INFINITUM: CAVEAT EMPTOR.
 SPX
SPXBullish long day. Midpoint above EMA(10). Still above all SMA's. Tested and held the 0.0% retrace (1597.57). New high on daily 3LB (reversal is 1552.01). QE2infinity. Still below 2 of 3 trend lines and RSI(14) above 50.
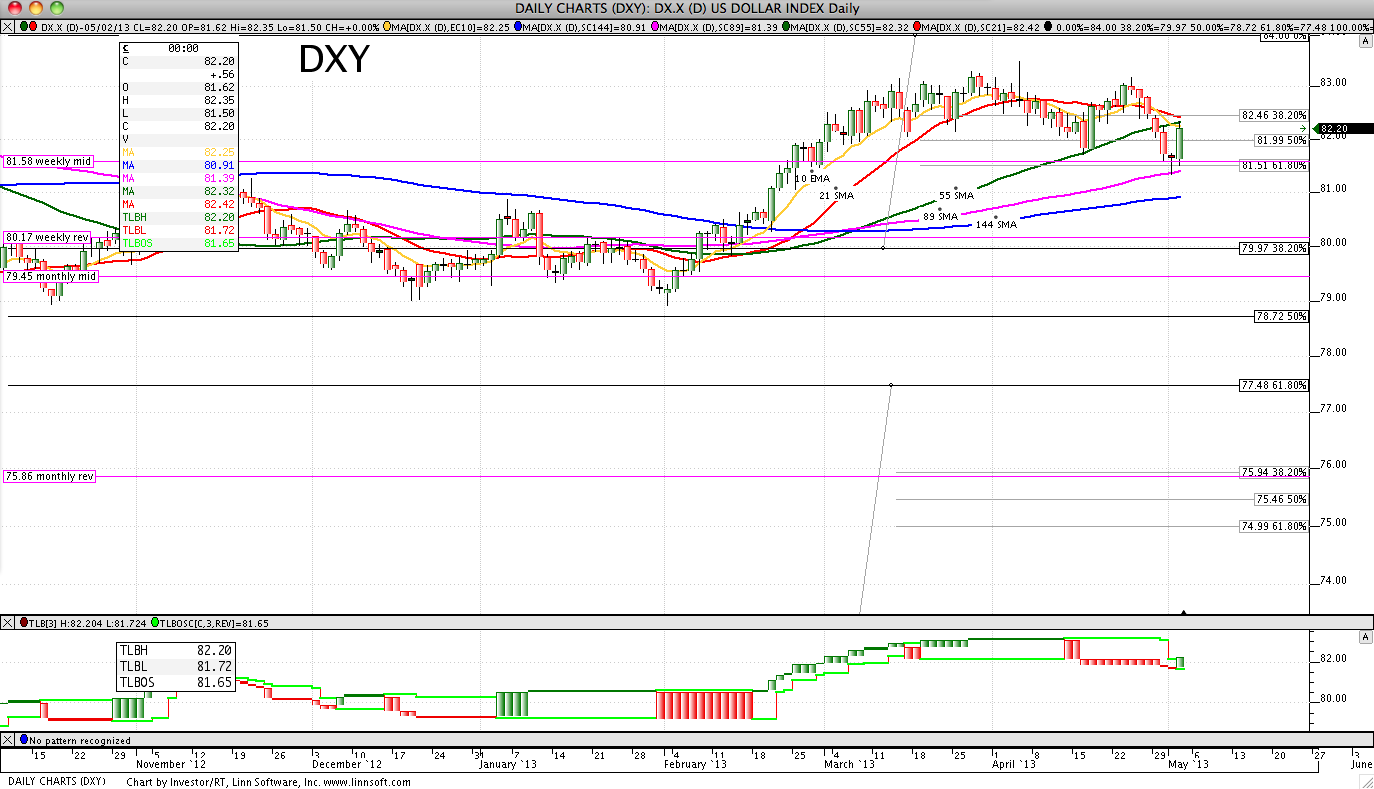 DXY
DXYBullish long day. Midpoint below EMA(10). Tested and held the 50.0% minor retrace (81.99). Tested and failed SMA(55). Dally 3LB reversal up (reversal is 81.65).
 VIX
VIXBearish long day. Midpoint above EMA(10). Tested and failed SMA(21,89,144). Still failing its 61.8% minor retrace (16.45). No daily 3LB changes (reversal is 13.36).
 GOLD
GOLDBullish short day. Midpoint above EMA(10). Holding above its 100.0% retrace (1407.40). Tested and failed SMA(21). No daily 3LB changes (reversal is 1586.70). Must have the precious.
 EURUSD
Bearish long day. Midpoint above EMA(10). Tested and failed SMA(21,89,144). Tested and failed its 38.2% retrace (1.3145). No daily 3LB changes (reversal is 1.2995).
 JNK
JNKBullish long day (closed gap). Midpoint above EMA(10). Still above all SMA's. Tested and held its 0.0% retrace (41.63). No daily 3LB changes (reversal is 41.75).
 10YR YIELD
Bearish short day. Still failing all SMA's. Midpoint below EMA(10). Still failing its 38.2% minor retrace (17.47). New low on daily 3LB (reversal is 16.85).
 WTI
WTIBullish long day. Tested and held SMA(21,55,144,233). Midpoint above EMA(10). Tested and failed its 61.8% minor retrace (94.01). No dally 3LB changes (reversal is 86.97).
 SILVER
Bullish harami day. Still failing all SMA's. Midpoint below EMA(10). Holding above its 0.0% retrace (22.55). No daily 3LB changes (reversal is 22.86).
 BKX
BKXBullish short day. Midpoint above EMA(10). Still above all SMA's. Holding above its 38.2% minor retrace (53.87). No daily 3LB changes (reversal is 54.03).
 HYG/LQD
Bearish short day. Still failing SMA(55,89). Midpoint above EMA(10). Holding above its 61.8% minor retrace (0.7765). No daily 3LB changes (reversal is 0.7752).
 COPPER
Bullish thrusting day. Midpoint below EMA(10). Still failing all SMA's. Tested and held its 0.0% retrace (3.102). No daily 3LB changes (reversal is 3.239).
 AAPL
AAPLBullish short day. Holding above SMA(55). Midpoint above EMA(10). Holding above its 38.2% minor retrace (406.99). Still failing BB(2,200). New high on daily 3LB (reversal is 392.05).
 GSCI
GSCIBullish long day (closed gap). Midpoint below EMA(10). Tested and held SMA(21). Tested and held its 61.8% minor retrace (31.04). No daily 3LB changes (reversal is 31.56).

IT HAS BEGUN. YOU HAVE BEEN WARNED.
6 comments:
For fun:
Taking the NFP from 5/11 to 3/13 and finding the average=124.957k.
The geometric mean is 66.136 and the harmonic mean is 33.517.
Since the harmonic mean is already 1/2 of the geometric mean then add/subtract the harmonic from the average.
April NFP prediction (can't be any worse than the other economists mystical predictions):
High 158.474k
Low 91.44k
NFP 165k. I was off by 7k. That's better than most economist LOL. But the NFP is the total inverse of the ADP report. Go figure.
NFP 165K
PRIVATE 176K
LFPR 63.3 -no change
U3 7.5 (-0.1) SA, 7.1 (-0.5) NSA
U6 13.9 (+0.1) SA, 13.4 (-0.5) NSA
27 WKS 4353K (-258K)
PART TIME 7916K (+278K)
TEMP 30.8K (+5.3K)
WKLY HRS 34.4 (-0.2)
CONSTRUCTION -6K (-19K)
MANUFACTURING 0K (-2K)
B/D 193K
Can you hear the sound of the bears running back to the caves?
And yet there was no TICK above 1000 on the "good news".
New.
Post a Comment