Morning Corner 8.31.11

SPX (weekly info)
-no change (below mid)
trend=down
low= 1123.53
rev= 1268.45; mid= 1195.99


It appears the fantasy of QE3 has permeated the market as it has pushed above it's weekly 3LB mid, SMA233, SMA89 & 50.0% retrace. So short-intermediate term sentiment is bullish but long term is bearish as the SPX may close below its monthly 3LB reversal price.


IWM/SPY (weekly info)
-no change (below mid)
trend=down
low= 0.5827
rev= 0.6246; mid= 0.6037


The proxy for liquidity is still indicating it's not there. So even though the market is up it isn't because of liquidity. It's still below SMA89, SMA55 & SMA13. It's also below its weekly 3LB mid. It appears traders collectively yelled "Show me the car fax!"

AmenRa's Corner

A place where a skillful caddy always offers cool contemplation when it comes to your "stick" selection.


"Will someone step up and keep me from crying?"

Creditcane™: My troops are memorizing Invictus as we prepare.


SPX
Spinning top day (possible evening star). Midpoint above EMA(10). Still above SMA(21). Tested and held the 50.0% retrace (1204.58). No daily 3LB changes (reversal is 1254.05). QE2infinity. Back above daily & weekly mids but still below monthly 3LB reversal.


DXY
Bullish short day. Midpoint below EMA(10). Holding above its 0.0% retrace (73.51). Failing the 38.2% minor retrace (74.40). Still below all SMA's. No daily 3LB changes (reversal is 75.75).


VIX
Doji day (possible bullish doji star). Midpoint below EMA(10). Still below SMA(21). Failing its 0.0% retrace (45.40). Tested and failed its 38.2% minor retrace (33.51). No daily 3LB changes (reversal is 25.25). Escaped the "extreme fear" zone.


GOLD
Bullish long day. Midpoint above EMA(10). Tested and held its 38.2% minor retrace (1828.28). Still above all SMA's. No daily 3LB changes (reversal is 1891.90). Must have the precious.


EURCHF
Bullish long day. Midpoint above EMA(10). Tested and held its 38.2% retrace (1.1717). Tested and held SMA(55). New high on daily 3LB changes (reversal is 1.1445).


JNK
Spinning top day (possible bearish harami). Midpoint above EMA(10). Still above SMA(21). Holding its 38.2% retrace (38.07). No daily 3LB changes (reversal is 39.59).


10YR YIELD
Bearish short day. Still failing all SMA's. Midpoint below EMA(10). Holding above its 0.0% retrace (20.92). No daily 3LB changes (reversal is 20.71).


WTI
Bullish short day. Still above SMA(21). Midpoint above EMA(10). Holding above its 0.0% retrace (80.32). Tested and held its 61.8% minor retrace (88.47). No dally 3LB changes (reversal is 92.08).


SILVER
Spinning top day. Holding above SMA(21). Midpoint above EMA(10). Tested and held its 38.2% retrace (40.74). No daily 3LB changes (reversal is 37.94).


BKX
Bearish short day (possible bearish harami). Midpoint above EMA(10). Still above SMA(21). Tested and failed its 50.0% minor retrace (39.61). No daily 3LB changes (reversal is 35.49).


HYG/LQD
Bullish short day. Holding above SMA(21). Midpoint above EMA(10). No test of its 0.0% retrace (0.7427). Holding above its 61.8% minor retrace (0.7682). No daily 3LB changes (reversal is 0.7910).


USDJPY
Spinning top day. Midpoint below EMA(10). Tested and failed SMA(21). Tested and held its 38.2% retrace (76.561). No daily 3LB changes (reversal is 76.46).


CRB
Bullish long day. Midpoint above EMA(10). Tested and held its 38.2% retrace (337.22). Daily 3LB reversal up (reversal is 316.12).


IT HAS BEGUN. BE WARNED.

Morning Corner 8.30.11

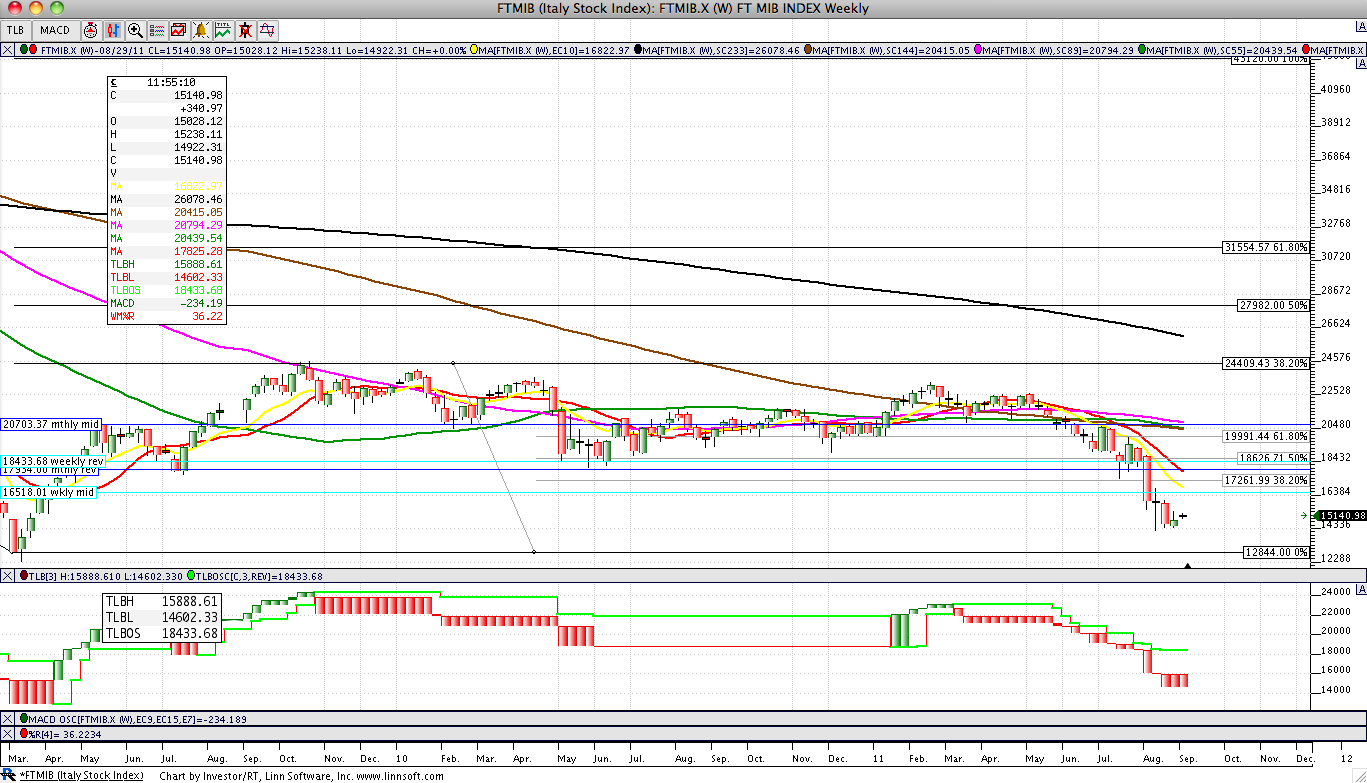
FT MIB (weekly info)
-no change (below mid)
trend=down
low= 14602.33
rev= 18433.68; mid= 16518.01


Italy is trying to push higher. It's a wasted effort. It's still below all SMA's and the weekly 3LB mid. It's also trading below it's monthly 3LB reversal.


CAC 40 (weekly info)
-no change (below mid)
trend=down
low= 3016.99
rev= 4101.31; mid= 3559.15


The CAC 40 is not confirming a bullish thrusting and has pushed above its 61.8% retrace. It's still below all SMA's and its monthly 3LB reversal price. It's MACD is moving higher and Williams %R has worked off its oversold condition. Still doesn't mean it's safe to get in the water.


DAX (weekly info)
-no change (below mid)
trend=down
low= 5480.00
rev= 6981.49; mid= 6230.75


Germany is also not confirming the bullish thrusting but is not above the midpoint of the bearish long candle. It is back above its 50.0% retrace. It's still below all SMA's. Does anyone notice that all three charts have the exact same formation?

AmenRa's Corner

A place where a skillful caddy always offers cool contemplation when it comes to your "stick" selection.


Creditcane™: You may have won this battle but I will win the war.


SPX
Bullish long day. Midpoint above EMA(10). Back above SMA(21). Tested and held the 50.0% retrace (1204.58). No daily 3LB changes (reversal is 1254.05). QE2infinity. Back above daily & weekly mids but still below monthly 3LB mid.


DXY
Spinning top day. Midpoint below EMA(10). Holding above its 0.0% retrace (73.51). Failing the 38.2% minor retrace (74.40). Still below all SMA's. No daily 3LB changes (reversal is 75.75).


VIX
Bearish short day (closed gap). Midpoint below EMA(10). Back below SMA(21). Failing its 0.0% retrace (45.40). Tested and failed its 38.2% minor retrace (33.51). No daily 3LB changes (reversal is 25.25). Escaped the "extreme fear" zone.


GOLD
Bearish long day. Midpoint above EMA(10). Failing its 50.0% minor retrace (1804.89). Still above all SMA's. No daily 3LB changes (reversal is 1891.90). Must have the precious.


EURCHF
Bullish long day. Midpoint above EMA(10). Tested and held its 38.2% retrace (1.1717). Tested and held SMA(55). New high on daily 3LB (reversal is 1.1425).


JNK
Bullish long day. Midpoint above EMA(10). Back above SMA(21). Tested and held its 38.2% retrace (38.07). No daily 3LB changes (reversal is 39.59).


10YR YIELD
Bullish short day. Still failing all SMA's. Midpoint above EMA(10). Holding above its 0.0% retrace (20.92). New high on daily 3LB (reversal is 20.71).


WTI
Bullish long day. Back above SMA(21). Midpoint above EMA(10). Holding above its 0.0% retrace (80.32). Tested and failed its 50.0% minor retrace (86.00). No dally 3LB changes (reversal is 92.08).


SILVER
Bearish short day. Holding above SMA(21). Midpoint above EMA(10). Tested and failed its 38.2% retrace (40.74). No daily 3LB changes (reversal is 37.94).


BKX
Bullish long day. Midpoint above EMA(10). Back above SMA(21). Tested and held its 50.0% minor retrace (39.61). New high on daily 3LB (reversal is 35.49).


HYG/LQD
Bearish short day. Holding above SMA(21). Midpoint above EMA(10). No test of its 0.0% retrace (0.7427). Holding above its 61.8% minor retrace (0.7682). No daily 3LB changes (reversal is 0.7910).


USDJPY
Spinning top day. Midpoint above EMA(10). Tested and failed SMA(21). Tested and held its 38.2% retrace (76.561). No daily 3LB changes (reversal is 76.46).


IT HAS BEGUN. BE WARNED.

Weekend Post: Hurricane Irene Edition

As the Wold Banksters gather in the idyllic mountain retreat of Jackson Hole, Wyoming, the East Coast was pounded by a Hurricane.  Anyone else see the symbolism there?

Any way, one of the headlines I saw was that Trichet was working on "radical" solutions for the Euro banks:
http://www.businessinsider.com/the-eu-is-working-on-a-radical-plan-for-banks-2011-8

Awesome.  All we need now is a radical plan how to make the bad debt disappear and we should be all "good."

One of the interesting events of the last week was Uncle Warren putting $5BN into BofA.  The interesting bit for me was how the Global Stock Market rallied huge on this "investment."  Hmmm....

So, you're telling me that a $5 Billion investment from a really rich investor can cause a global rally in asset values worth $500BN to $1 Trillion?  And, we also learned in 2010 that the market can "flash crash" just because some firm decides to sell $3BN in S&P futures in a short period of time?

"C'mon Man!"

If the markets are truly this fragile and vulnerable, then what's going to happen if something really bad happens?  

Ooops.  I almost forgot....the markets did lose 60% of it's value in less than TWO years way, way, way back in 2009.

And, we wonder why people would rather park their bucks in low yielding Government securities....

I've been thinking more about gold lately, thus it's the focus of my efforts the last few weekends.  I find myself wanting to short OCT straddles, like the 1700/1900 or 1600/1900.  I think we're going to lapse into triangular congestion next several weeks.   I also find myself wanting to just take a stab at being short OCT futures around $1854.

Gold Report 28AUG11


In regard to the S&P 500, I just see more "sideways" triangular chop in the next 2-3 weeks.  Zzzzzzz.

Disclosure/Warning

This blog should not be interpreted as investment advice of any kind. The authors are NOT representing themselves CTAs or CFAs or Investment/Trading Advisor of any kind. The authors may or may not trade in the markets discussed. The authors may hold positions opposite of what may by inferred by this blog.The information contained in this blog is taken from sources the authors believes to be reliable, but it is not guaranteed by the authors as to the accuracy or completeness thereof and is presented here for information purposes only. Commodity trading involves risk and is not for everyone.