AmenRa's Corner

A place where a skillful caddy always offers cool contemplation when it comes to your "stick" selection


Creditcane™: What happened? I happened. I enjoy a confused market. Allows me to wreck more havoc.


SPX
Bullish long day. Midpoint above EMA(10). Back above the trendline (3/6/09-7/1//10). Above the SMA(21) & SMA(55). Holding above 1078.87 (1.618 fib from low). New high on daily 3LB (reversal is 1047.22). QE2infinity.


DXY
Doji day. Held the the SMA(21). Midpoint below EMA(10). New low on daily 3LB (reversal is 83.26).


VIX
Bearish short day. Midpoint below EMA(10). Below weekly 3LB mid and monthly 3LB mid. Now below the SMA(21) & SMA(144). New low on daily 3LB (reversal is 26.44). Trending down on daily 3LB.


GOLD
Bullish short day. Bearish harami failed. Still above all SMA's. Midpoint above EMA(10). Yet is still heading towards the 0% (we'll see). New high on daily 3LB (reversal is 1234.20).


EURUSD
Bullish short day. Midpoint below EMA(10). Held the 23.6% retrace. Still failing the 4x1 Gann. Now above the SMA(55). It's above the trendline (11/27/09-3/17/10). New high on daily 3LB (reversal is 1.2672).


JNK
Bullish short day. Still failing to close gap. Above the SMA(21), SMA(89) & SMA(144). Midpoint above EMA(10). No daily 3LB changes (reversal is 37.72).


10YR YIELD
Bullish short day. The new 0.0% fibo retrace at 24.69 has held. Midpoint above EMA(10). Below all SMA's. Closed the second gap (1 more left). No daily 3LB changes (reversal is 26.85).


AUDJPY
Spinning top day. Midpoint above EMA(10). Above SMA(21), SMA(55) & SMA(144). Tested and failed SMA(89). New high on daily 3LB (reversal is 75.8121).


DJ TRANS AVG
Bullish long day. Back above the upper trendline and all SMA's. Midpoint above EMA(10). New high on daily 3LB (reversal is 4082.51). Above weekly 3LB reversal price.


WTI
Bullish short day. Still below all SMA's. Midpoint above the EMA(10). No daily 3LB changes (reversal is 71.63).


LEFTBACK'S BOND REPORT

The Bond Report 9.2.10

Yesterday's FLIGHT FROM QUANTITY continued and the STEEPENER was extended today as inwestors shunned the long bonds they so eagerly embraced just last week. HY outperformed IG as spreads tightened a little. 2s10s got out there, to about 216 at one point, I think.

Corpies: LQD -0.13%; AGG -0.13%; JNK 0.18%; HYG 0.16%;
Govies: TLT -1.06%; IEI -0.14%; TIP -0.19%
Hedgies: TBT 2.17%

We did nothing in bonds - except to wish we had kept our shorts on overnight, but in this market sleeping naked means never having to say sorry you lost your profit in the morning.... actually we slapped on an equity short, responding to that little voice that reminds us we just made 5% in two days and it is Thursday.

The Friday before a long weekend usually sees a safety trade, so we see Treasuries being bought and a generally risk-off environment unless OBAMA has created a MILLION jobs overnight. We would probably fade the safety move into tomorrow's close as we think the long bond is a delicious short just at the moment.


Morning Audibles 9.2.10 - Secret Sauce

So we had a big "long white candle" day yesterday... Bulls are out again right... And there are blogs (and opinionaters) all over the web to explain why... Some will even tell you they FORECAST the move... Apparently these are individuals who possess some kind of "SECRET SAUCE" which we all want a dollop of... Right? RIGHT?


We'll get to that later... First I want to to get to the long white candle (from yesterday)... Here's what it looked like...


Actually, it looks to me like there have been a whole bunch of these since the April highs... They're not so uncommon after all... But, I can't say either they happen all that frequently (if you consider the aggregate number of candles)... The records will tell you that they RARELY happen in "bull markets"... More troubling is the fact that despite the fact that PRICES RISE when they appear out of nowhere, the "net sum" of prices has gone down... If you look closely, they seem to disappear altogether as they either reach, or peek over the red and blue lines (which are "moving averages", and other indicators that market TECHNICIANS put to use)... 


But TECHNICAL ANALYSIS is for sissies... How can one determine whether or not any form of technical analysis is valid? Who's the "Validation CZAR" in this country? What CV has found is that there are some around who are the first in line to "criticize" EWI theory, and as a substitute, grandstand around with their own genius ideas about how markets will behave... Here - I'll show you an example... I present to you "Thing 1 & Thing 2"...


Here comes that SECRET SAUCE I was promising, so get your pens & notebooks handy boys & girls...Thing 1 says...


Thing 2 (who operates in a perpetual state of agreement - as long as you're not a bully) says... I agree because that's what I do... When I'm not agreeing, I run around making sure everyone else agrees, and when that doesn't work I mesmerize everyone with cute puppy & kitten pictures until they soften up...


CV says... Hmmm... "ELECTIONS"... (or as an Asian might pronounce it... "E*ECTIONS" - no - we were doing Asian accents on yesterdays thread)... OK, so we've turned the calendar to September... We're in the final sprint to the November elections... So I guess this is the point where the GOVERNMENT MANIPULATORS (who - of course - always have their hand on the wheel and all things are firmly in their capable grasp) can just put the thing into cruise control... Capital Markets? Piece of Cake!...


We're on OTTOPILOT (as Thing 1 & Thing 2 point out), until election day... Otto the pilot will take it from here...


Since we have national elections every 2 years in this country (for now)... I decided to examine just HOW, on "ottopilot", things have been lately on this glide path & final approach...


2008 - Nothing to say but...DOH!


Meh... Must have been an abberation... Let's keep digging

2006 - Now that DUBYA knew how to "control" things... Right?

2004 - Hell yeah! That's what I call an ERECTION!

2002 - Eddie Munster's Hairdo?

2000 - Must have been all that missing WH China

1998 - Was LTCM running for Congress?

1996 - Al Gore "invented" control, right?

1994 - Holy Smokes - The Charlie Brown Shirt Pattern

1992 - It's the ECONOMY Stupid!

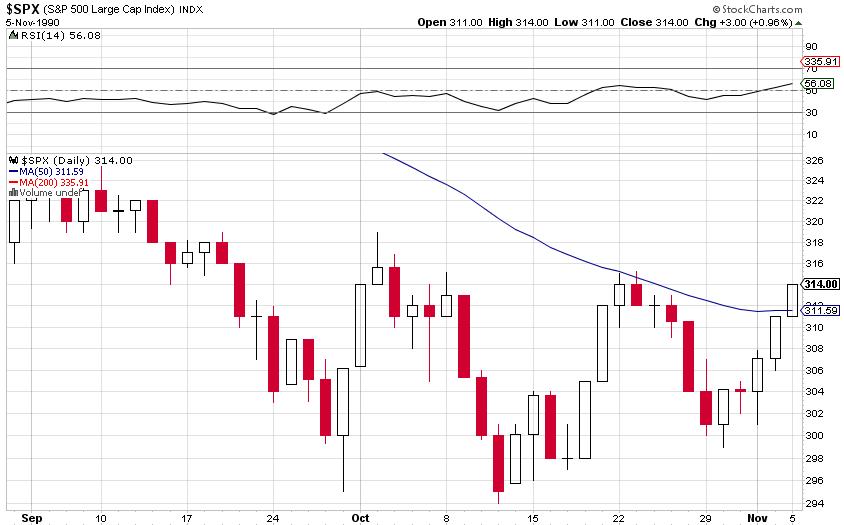
1990 - Grunge Never Looked So Good

1986 - "What the...?"

1984 - Only Walter Mondale to beat and that's the best you could do?


1980 - Get Carter

Y'all can do whatever you want... The only thing apparent to me (over the past 30 years since I've been a registered voter), is that if one attempts to attach a GOVERNMENT MANIPULATION theme to CAPITAL MARKETS in the run-up to an election... and sees CORRELATION, or CAUSATION... Well to me, it has about as much correlation as this...


Or they might be smoking this...


Which, I suppose is OK if you're anonymous trader (using practice money)... But I'd think that someone who manages large chunks of OTHER PEOPLES MONEY (and accepts a certain responsibility for doing so)... Comes prepared with some better tools (instead of just coming "AS" a tool because the time period coincides with that of Halloween)...


Or there's always the nifty GLADIATOR outfit as well...


ROCKS


AmenRa's Corner

A place where a skillful caddy always offers cool contemplation when it comes to your "stick" selection


Creditcane™: I play both sides. No trade is safe when I'm around.


SPX
Bullish long day. Morning star confirmed. Midpoint above EMA(10). Back above the trendline (3/6/09-7/1//10). Passed the third test of 1041.83 (.1459 fibo from high). Back above 1078.87 (1.618 fib from low). Daily 3LB reversal up (reversal is 1047.22). QE2infinity.


DXY
Bearish long day. Failed the SMA(144). Midpoint below EMA(10). New low on daily 3LB (reversal is 83.31).


VIX
Bearish short day. Midpoint below EMA(10). Below weekly 3LB mid and monthly 3LB mid. Now below the SMA(21) & SMA(144). New low on daily 3LB (reversal is 27.46).


GOLD
Bearish harami day. Still above all SMA's. Midpoint above EMA(10). Yet is still heading towards the 0% (we'll see). No daily 3LB changes (reversal is 1230.10).


EURUSD
Bullish long day. Midpoint slightly below EMA(10). Held the 23.6% retrace. Still failing the 4x1 Gann. It's above the trendline (11/27/09-3/17/10). New high on daily 3LB (reversal is 1.2654).


JNK
Bullish long day (yet closed unchanged). Still failing to close gap. Above the SMA(89) & SMA(144). Midpoint below EMA(10). No daily 3LB changes (reversal is 37.72).


10YR YIELD
Bullish long day. The new 0.0% fibo retrace at 24.69 has held. Midpoint below EMA(10). Below all SMA's. closed one gap (2 more left). No daily 3LB changes (reversal is 26.85).


AUDJPY
Bullish long day. Midpoint above EMA(10). Above SMA(21), SMA(55) & SMA(144). Tested and passed the 23.6% retrace at 75.5696. New high on daily 3LB (reversal is 74.2463).


DJ TRANS AVG
Bullish long day. Back above the upper trendline, the SMA(233), the SMA(55) and SMA(21). Midpoint above EMA(10). Daily 3LB reversal up (reversal now 4082.51). Above weekly 3LB reversal price.


GS
Spinning top day (really? as bullish as today was?). Below all SMA's. Midpoint below the EMA(10). Below the 14.6% retrace. No daily 3LB changes (reversal is 143.95).


LEFTBACK'S BOND REPORT

The Bond Report 9.1.10

Ah, risk! A rose by any other name should smell as sweet....

Corpies: LQD -0.61%; AGG -0.33%; JNK 0.83%; HYG 1.02%;
Govies: TLT -2.08%; IEI -0.34%; TIP -0.43%
Hedgies: TBT 4.06%

We covered our short of the long bond, and enjoyed the screams. A little too much, perhaps, but that's what makes us who we are...

POMO tomorrow. Then we get to do this all over again.
Sublime. Admit it, we are good.


Morning Audibles 9.1.10

Welcome to September (traditionally - the WORST performing month of the year, on average, for equities - though you wouldn't know it by the S&P futures which are on track to gap up 10 points on news that China’s purchasing managers’ index had a WHALLOPING rise to 51.7 from 51.2)...

Pardon Me while I Raff Out Roud

For those of you who don't understand Chinese, that basically means that there will be 517 vacant buildings in every city instead of 512... A 5 building increase!

So now the FOXCONN employees won't have to stand in line anymore to jump out of windows...

Anyway... Since CV gets paid just about as much as these contented little worker bees... I'll offer my ENTIRE PAYCHECK and give you all the 5 cent rundown:

- Yeah I suppose the indices (which always lead) are a little oversold "short term"
- Yeah we had a "generational" triple bottom at 1040... count 'em! 3 in 26 hours! GENERATIONAL I say!
- Yeah it's the first of the month (time for Jamie & Lloyd to offload their overpriced crap onto your friendly neighborhood 401k manager... You know... For THE FUN)...
- Yeah it's still summer (and remember - this is the SUMMER OF HOPE - so we have that going for us)... And even though "Creditcane Earl" is bearing down on the Hamptons, well, for masters of the universe, that is just an excuse to go windsurfing, right?

So the question is? How long will this last?

Frankly... I have no idea... Many wavers still have tight ranges (not giving much more than the 1070 - 1080 area)... Some others like RETESTS back up in the 1110 area... And then there are still gaps to fill, potentially, around 1120 and way up at 1150...

What I thought I'd do is take a broader look at things... The following is a MONTHLY chart (going clear back to 1987)... Stock Market people remember that year... And it was also the year that this movie came out...


And here's what the S&P has done since then...

I think pictures tell their own words but since I make the BIG BUCKS here, I'll offer up what I see for free... (admitting this is REARVIEW MIRROR analysis)...

- The straight line ruler from the post 1987 crash low thru the monthly closing candle low in 2002 takes us to a point that the market lost this summer, and is thus far failing to regain... It is very close to the 1130 level where the market failed on the July candle, and now the August candle as well

- The 233 month moving average & 377 month moving averages are on the chart... When looking at things from a long term perspective, you need to apply long term thinking... 233 months takes you back to about 1991... 377 takes you all the way back to 1978... At minumum, these should "smooth out" presidential cycles, credit bubbles, and CRAZY IVAN Fed czars...

- The RSI (of the "bubblicious" 2003-2007 period, and the "fear-a-licious" 10/08 - 7/09 period can be seen is periods OUTSIDE of a fairly flattish wedge which extends back 15 years. The most recent months show some consolidation within, but the August candle produce a a trend line break of the trajectory since the March '09 lows... It may be nothing, but in May the trend line was broken as well, and the move to do so happened to be the flash crash...

So again... For all I know, this chart is worth nothing more than looking back at 1990 candles and reminiscing about that night in Copenhagen with "Rannevig" from Iceland...

Or you could instead LOOK FORWARD to Wall St. II... Where I suppose "Greed" is still "Good" and "Money Never Sleeps" because it's all debt and electrons anyway... (Here, see for yourself)...


Good luck trading...

Disclosure/Warning

This blog should not be interpreted as investment advice of any kind. The authors are NOT representing themselves CTAs or CFAs or Investment/Trading Advisor of any kind. The authors may or may not trade in the markets discussed. The authors may hold positions opposite of what may by inferred by this blog.The information contained in this blog is taken from sources the authors believes to be reliable, but it is not guaranteed by the authors as to the accuracy or completeness thereof and is presented here for information purposes only. Commodity trading involves risk and is not for everyone.